How Google Cloud Platform Trace Helps Optimization
Powerful insights into what your app is doing in the cloud
Contents
Introduction
There are many challenges to understanding what our code is really doing at runtime:
- The source code we work with is just a representation of the code that the compiler produces and which actually executes.
- Systems are handling multiple requests at the same time.
- Serving a request often relies on remote calls that our systems make to other services.
- Systems are running in the cloud on virtual machines.
We can’t always just attach a debugger and step through our code unless it’s running locally. But when it’s running locally, it’s not really representative of the live system. The only way to see what the live system is doing is to instrument it.
Fortunately, Google provide a fantastic tracing tool for their cloud platform which can provide valuable insights into your application even when calls span multiple services.
Here’s an example of using it to optimize code.
For this example, I had a web app that displays user avatars. The avatars are displayed at different sizes within different parts of the system (e.g. the version used for a comment is smaller than the main profile page) and, coupled with responsive design that also changes sizes based on the device screen size, it’s typical that a single avatar may appear at 4 or 5 different sizes.
I tried to make good use of caching and use the excellent groupcache package that provides a memcache-like service that runs peer-to-peer on the front-end servers (checkout the clustering package I made to help make that easier).
When a request comes in, the system asks the cache for the correctly sized version. If that version doesn’t exist yet, the system asks for the source image and resizes it (with that version then cached for subsequent requests). The request for the source image also goes through a cache request so we avoid loading it directly from storage each time (which can save money as well as improve performance).
This layered-caching approach works well with cached items served near instantaneously. Any requests that fall through to the next layer end up producing a noticeable staggered response-time distribution:
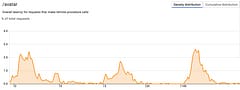
NOTE: I’m cheating a little - you don’t get this insight until you have the top level tracing added at least.
Rather than just settle for “uncached is slower” it seemed like a perfect scenario to try out the cloud tracing in order to understand exactly which parts of the system accounted for the time and where any performance gains might be possible. Is more time spent resizing images or retrieving the sources for example?
Cloud tracing works with “spans” which at the top level cover the entire request for a handler but allow for child spans to be created to highlight how long was spent in each sub-section. The really great thing is that the identity of the trace can be passed across machines to continue the measurement for remote procedure calls.
For this example I added some middleware to create the initial span to represent the request and make it available through the context.Context that is passed to all the services.
package main

import (
	"context"

	"net/http"

	"cloud.google.com/go/trace"
)

type (
	cloudTracer struct {
		client *trace.Client
	}

	contextKey int
)

const spanKey contextKey = 0

// newTracer creates a new cloud tracer
func newTracer(client *trace.Client) *cloudTracer {
	return &cloudTracer{
		client: client,
	}
}

func (t *cloudTracer) middleware(next http.Handler) http.Handler {
	fn := func(w http.ResponseWriter, r *http.Request) {
		span := t.client.NewSpan(r.URL.Path)
		defer span.Finish()

		ctx := contextWithSpan(r.Context(), span)
		next.ServeHTTP(w, r.WithContext(ctx))
	}

	return http.HandlerFunc(fn)
}

func contextWithSpan(ctx context.Context, span *trace.Span) context.Context {
	return context.WithValue(ctx, spanKey, span)
}

func spanFromContext(ctx context.Context) *trace.Span {
	return ctx.Value(spanKey).(*trace.Span)
}
Adding this middleware gives us the top-level trace entries to show that the traces are being recorded. We can also instrument methods to record the times that they take:
span := spanFromContext(c).NewChild("getblob")
defer span.Finish()
We can immediately see that the image resizing is plenty fast enough and most of the time is spent retrieving the source blob from Cloud Storage:
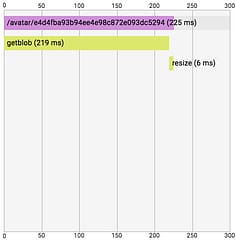
Now we know that we need to focus our attention on the source blob retrieval method. Is there any way we can speed this up?
It turns out that we need to read both the image bytes and some cloud-storage metadata associated with the image (last-updated time, MD5 checksum used for ETag) and this requires two separate calls. Let’s instrument those so we can see what’s happening:
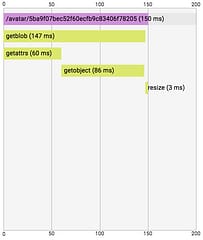
Of course, we make two calls one after the other so the latency for the getblob method is the combined times. Fortunately, Go makes it easy to make these calls happen concurrently and when we do this we can see the time we save:
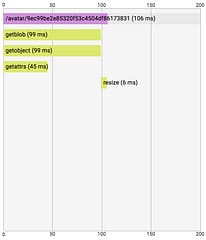
We’ve roughly halved the time that the longest requests were taking, bringing down the response times for these requests and because of how groupcache de-dupes requests it can help reduce the overall load on the system.
This is just a simple example of the insights that Google Cloud Trace can provide. As systems become more complex with more interconnected services, the ability to trace what is contributing to the total response time for any request goes up dramatically and can help focus efforts on the pieces that will provide the biggest performance paybacks.